Network visualisation
Results of active module identification (AMI) and random walk with restart (RWR) approaches can be visualised using Cytoscape [1].
This page contains a guideline, step by step, to create network visualisation of results such as those presented in this documentation.
Active module identification results visualisation
Tip
To run an Active Module Identification with data retrieved by queries, see Use-case 1 and with data provided by user, see Use-case 2.
The Fig. 6 is an example of AMI results visualisation.
Fig. 6 : Use-case 1 AMI analysis visualisation (from Fig. 19). We use Cytoscape [1] to create network visualisation and Omics Visualizer [2] to add overlap results to active modules.
Step by step guidelines
To visualise the AMI results using network representation, use the following steps:
1. Import files
Fig. 7 : Step 1 - Import files
Import Network from File:
DOMINO_*_activeModulesNetwork.txtImport Table from File:
DOMINO_*_activeModules.txt(Import Data as Node Table Columns)
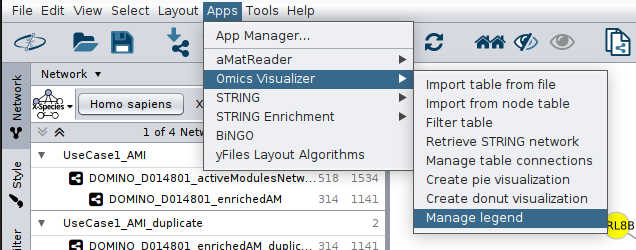
2. Add donuts
Omics Visualizer [2] table from File:
DOMINO_*_overlapAMresults4Cytoscape.txtManage table connections: link network node table with right identifiers
Network: sharedname
Table: geneSymbol
Donut Chart Visualisation: Add overlap results using donuts (Use termTitle)
3. Network style
Fig. 9 : Step 3 - Apply style that you want
Border Width =
5.0- Fill Color =
ActiveGenes True #CCCCCC
False #FFFFFF
- Fill Color =
Label Font Size =
20Shape =
EllipseSize =
50Lock node width and height
4. Active module selection
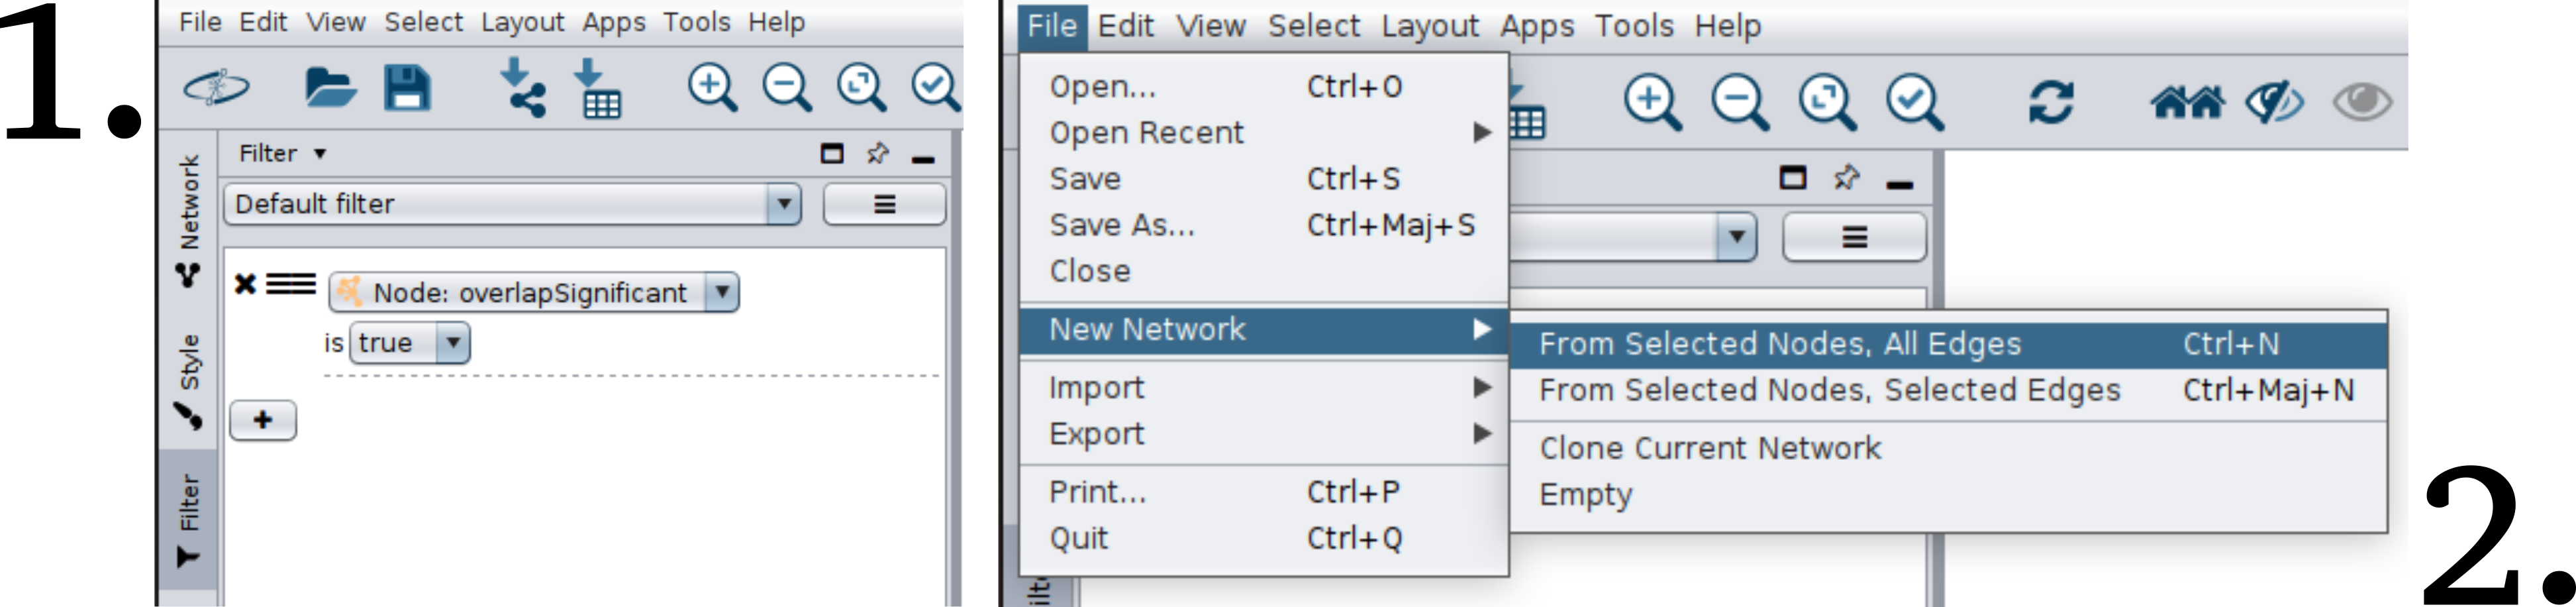
Fig. 10 : Step 4 - Select identified active module with a significant overlap
Filter: Select nodes with
overlapSignificant = TrueNew Network: From Selected Nodes, All Edges
Tip
You can select modules that you are interested in directly (Ctrl + mouse drag) then create a new network from selected nodes (step 2 above).
5. Create legends
Random walk with restart results visualisation
Tip
To perform a RWR with data retrieved by queries, see Use-case 1 and with data provided by user, see Use-case 2.
The Fig. 12 is an example of RWR results visualisation.
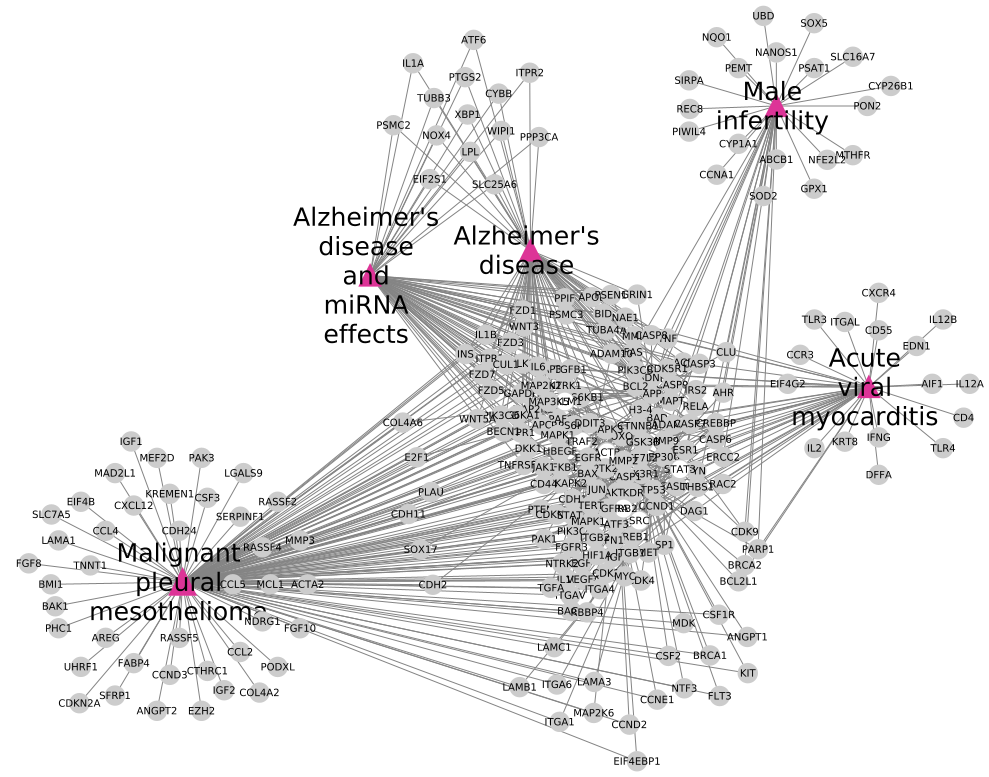
Fig. 12 : Use-case 1 RWR analysis visualisation (from Fig. 20). We use Cytoscape [1] to create network visualisation.
Step by step guidelines
To visualise the RWR results using network representation, use the following steps:
1. Import files
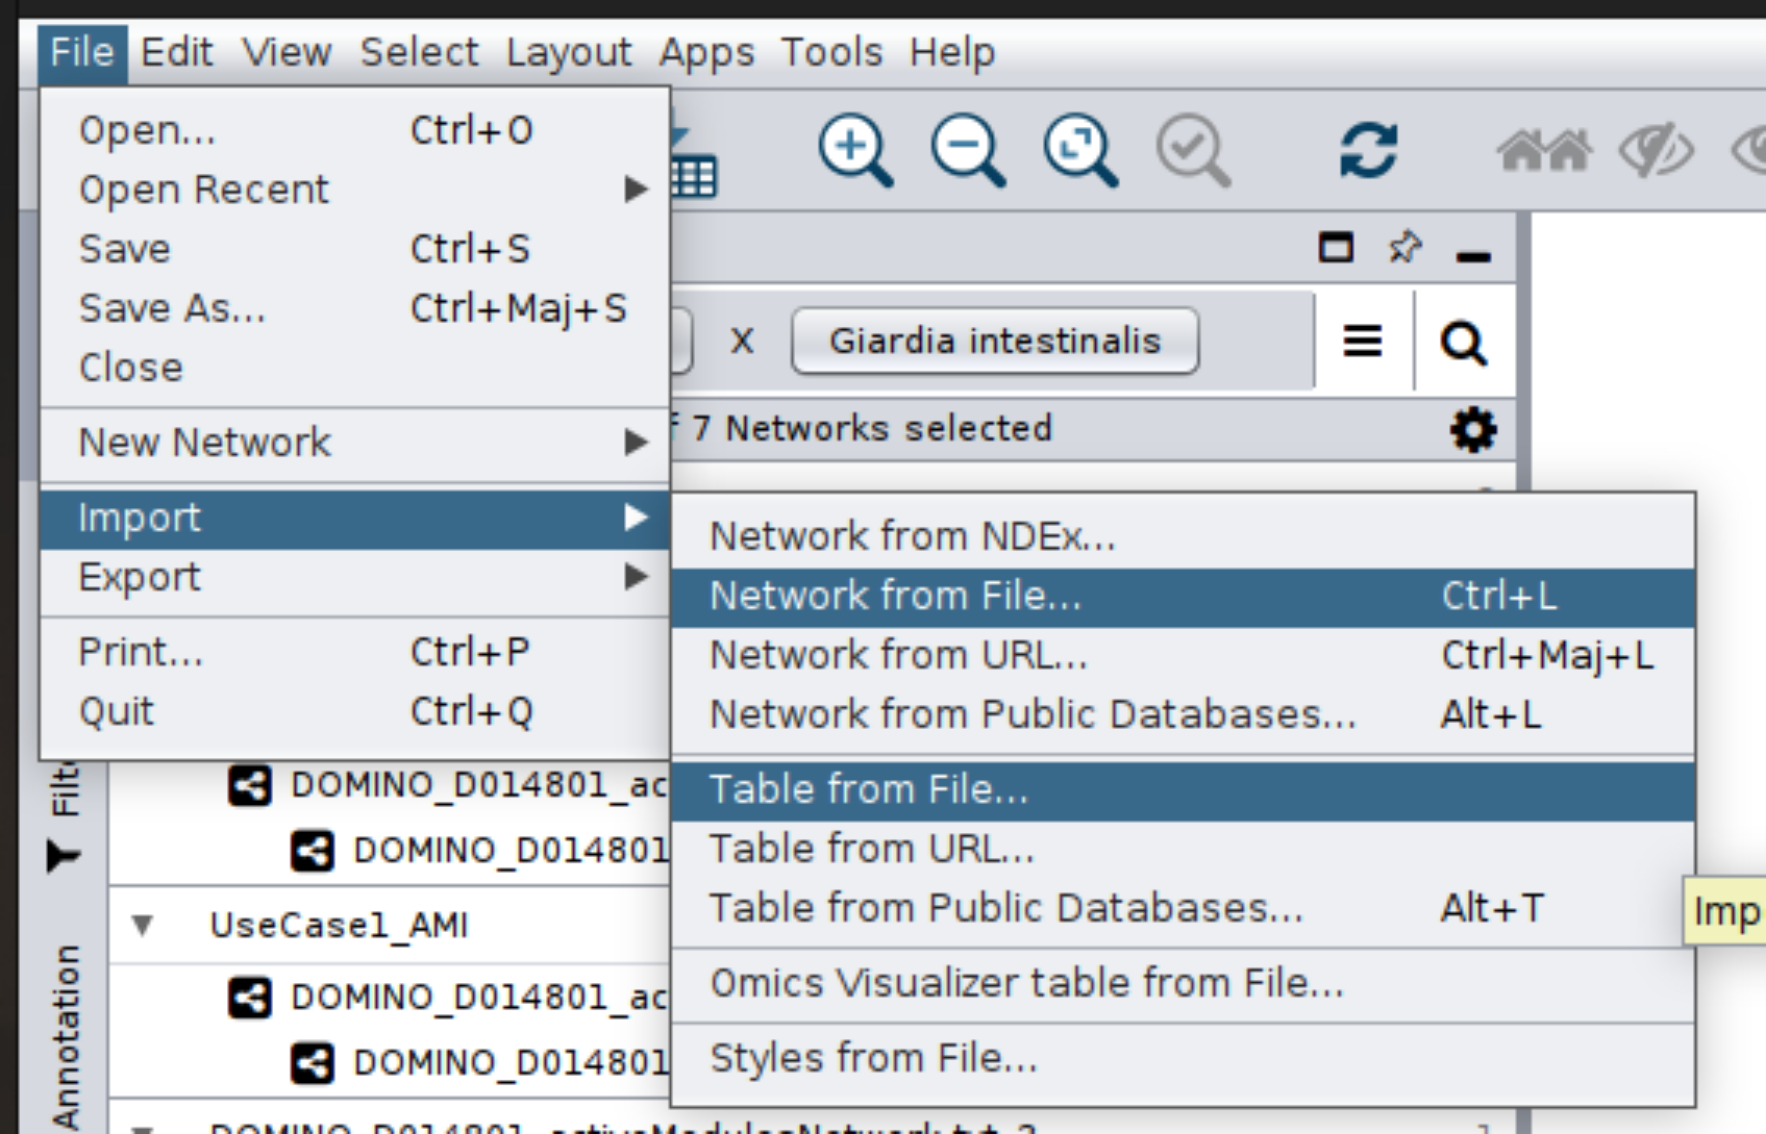
Fig. 13 : Step 1 - Import files
Import Network from File:
UseCase1_RWR_network.sifImport Table from File:
multiplex_1.tsvandmultiplex_2.tsvImport Table from File:
seeds.4CytoscapeChange column names:
nodefor column 1 andseedfor column 2
Tip
How create the seeds.4Cytoscape file ?
awk -F"\t" 'NR==FNR{a[$1]; next} {if($2 in a){print $2"\tTrue"}else{print $2"\tFalse"}}' seeds.txt multiplex_1.tsv > seeds.4Cytoscape
Import Table from File:
diseasesDescription.txtChange column names:
nodefor column 1,pathwaysfor column 2 andscorefor column 3
Tip
How create the diseasesDescription.txt file ?
awk -F"\t" 'NR==FNR{a[$1]=$2; next} {if($1 in a){print $1"\t"$2"\t"a[$1]}}' RWR_top20.txt ../../OutputOverlapResults/WP_RareDiseases_request_2022_09_07.gmt > diseasesDescription.txt
2. Management of nodes table
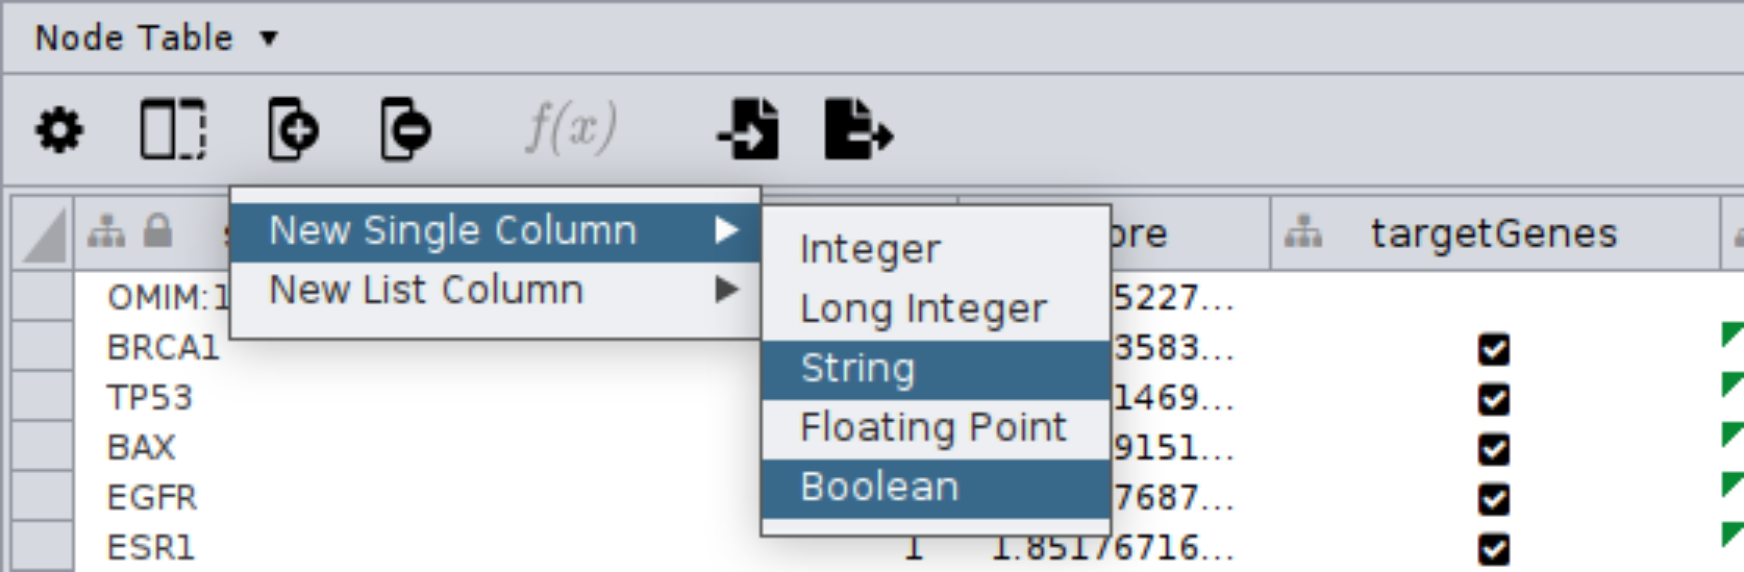
Fig. 14 : Step 2 - Create two new columns
Create two new columns named
labelas string andkeepas boolean in the node table
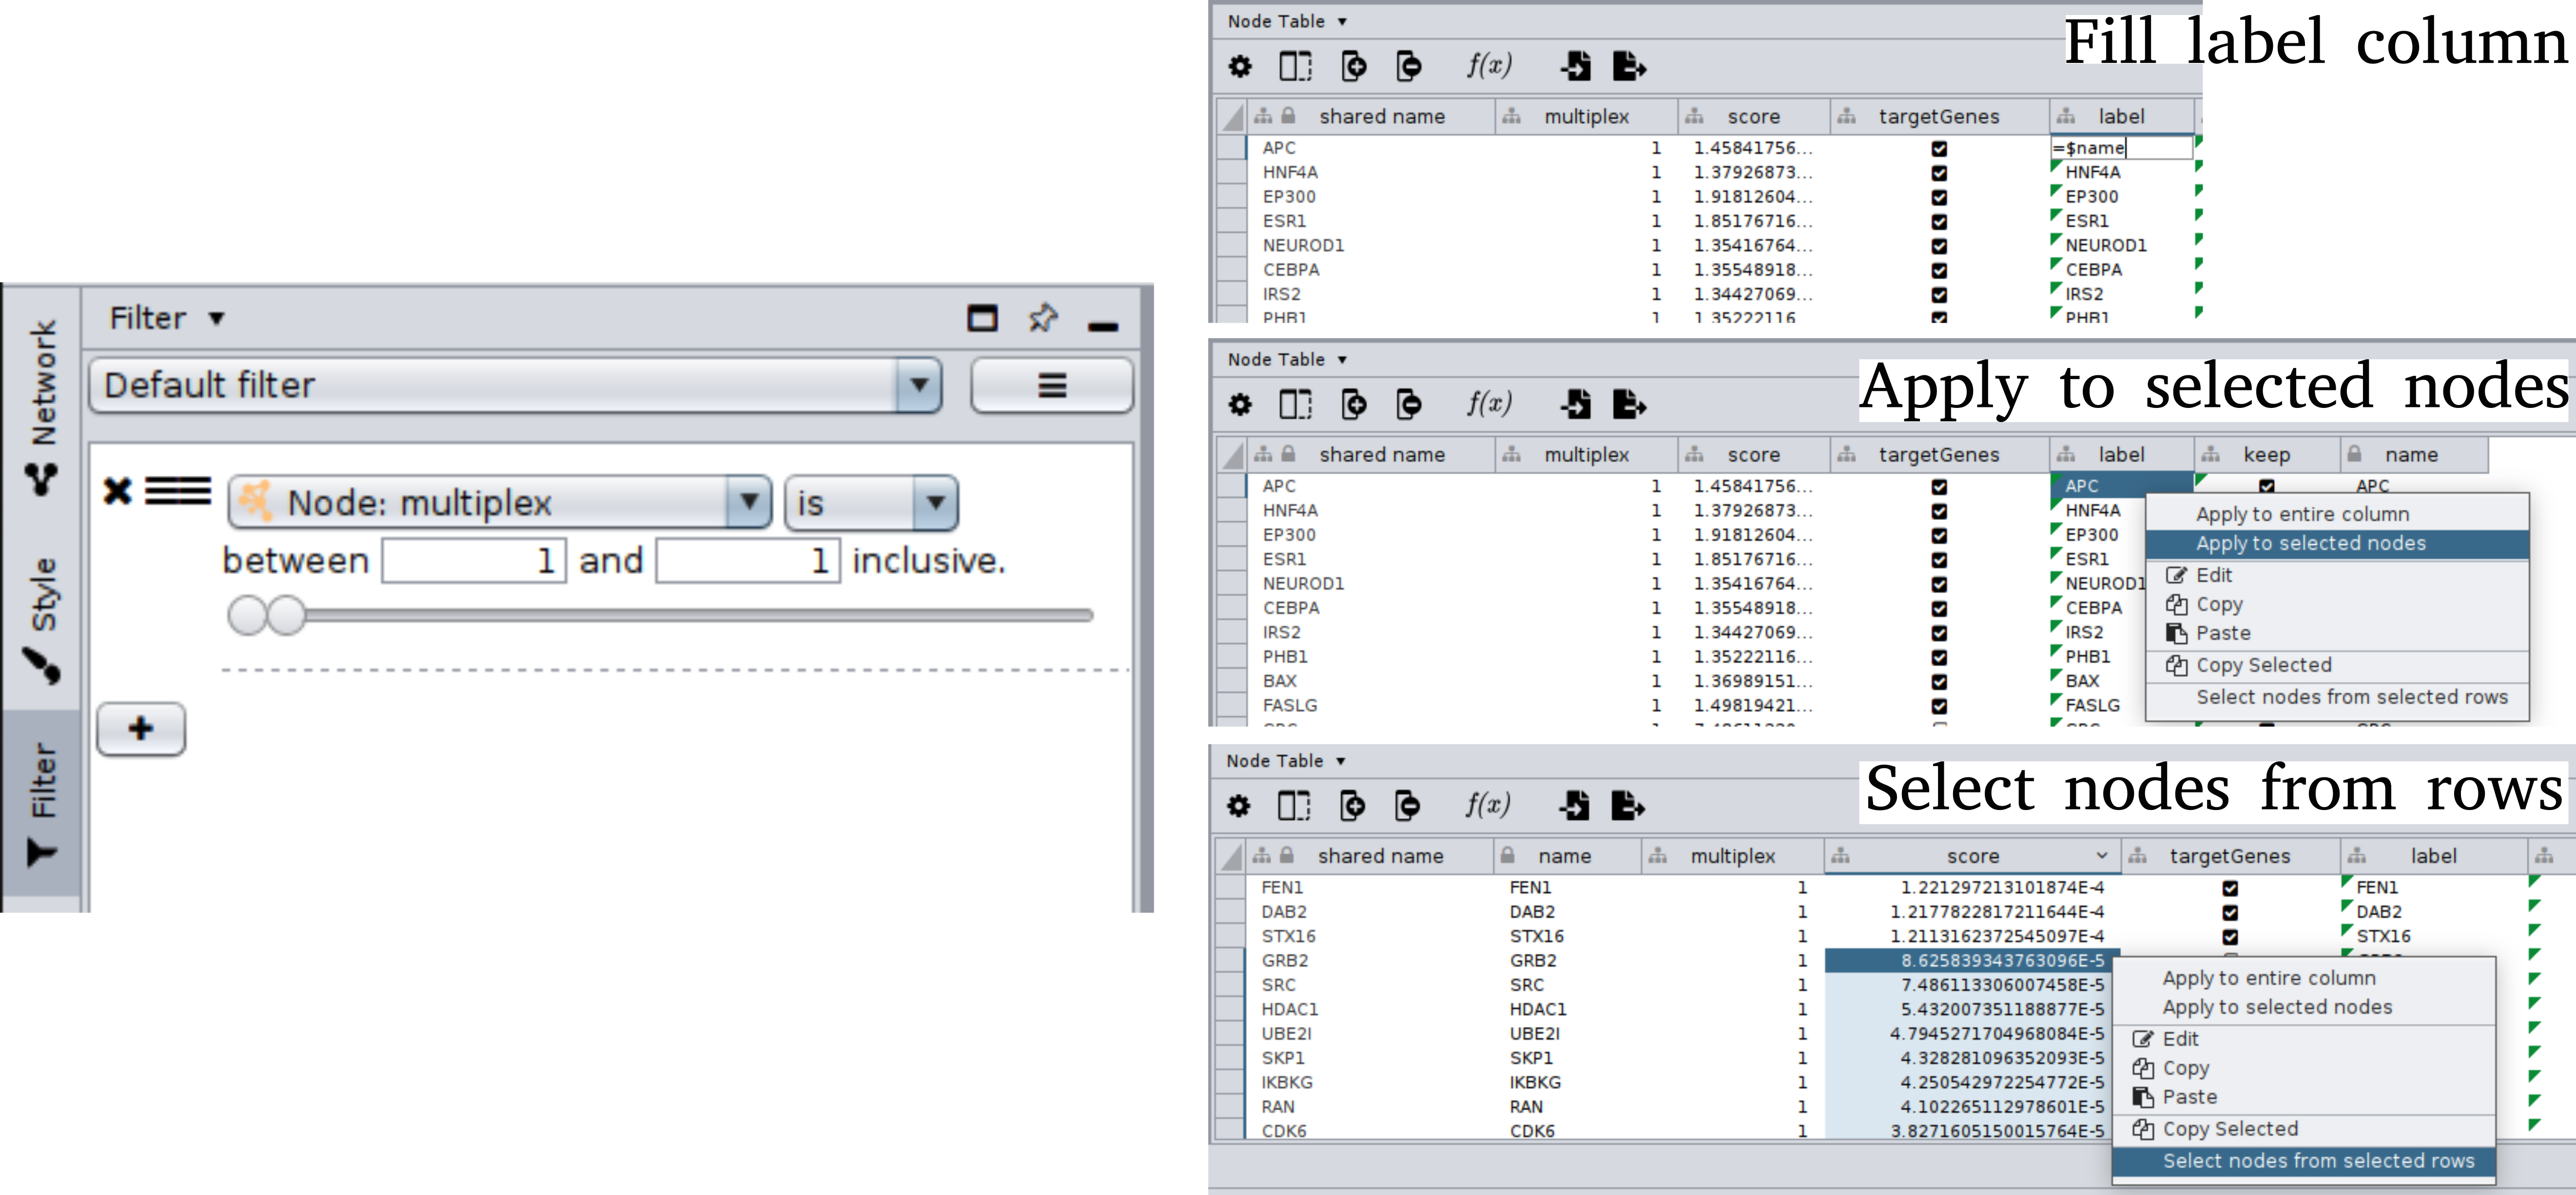
Fig. 15 : Step 2 - Select nodes using Filter and fill node table
Filter: Select genes nodes (multiplex is 1)
Fill
labelcolumn with=$nameand apply to selected nodesFill
keepcolumn with=$seedand apply to selected nodesSort by
score(decrease) and select the 30th first genes that are not a seed (selected nodes from selected rows)Fill
keepcolumn with=Trueand apply to selected nodes
Filter: Select are disease pathways nodes (multiplex is 2)
Sort by
score(decrease) and select the 5th first rare disease pathwaysFill
keepcolumn with=TrueFill
labelcolumn with=$pathwaysand apply to selected nodes
3. Create new network
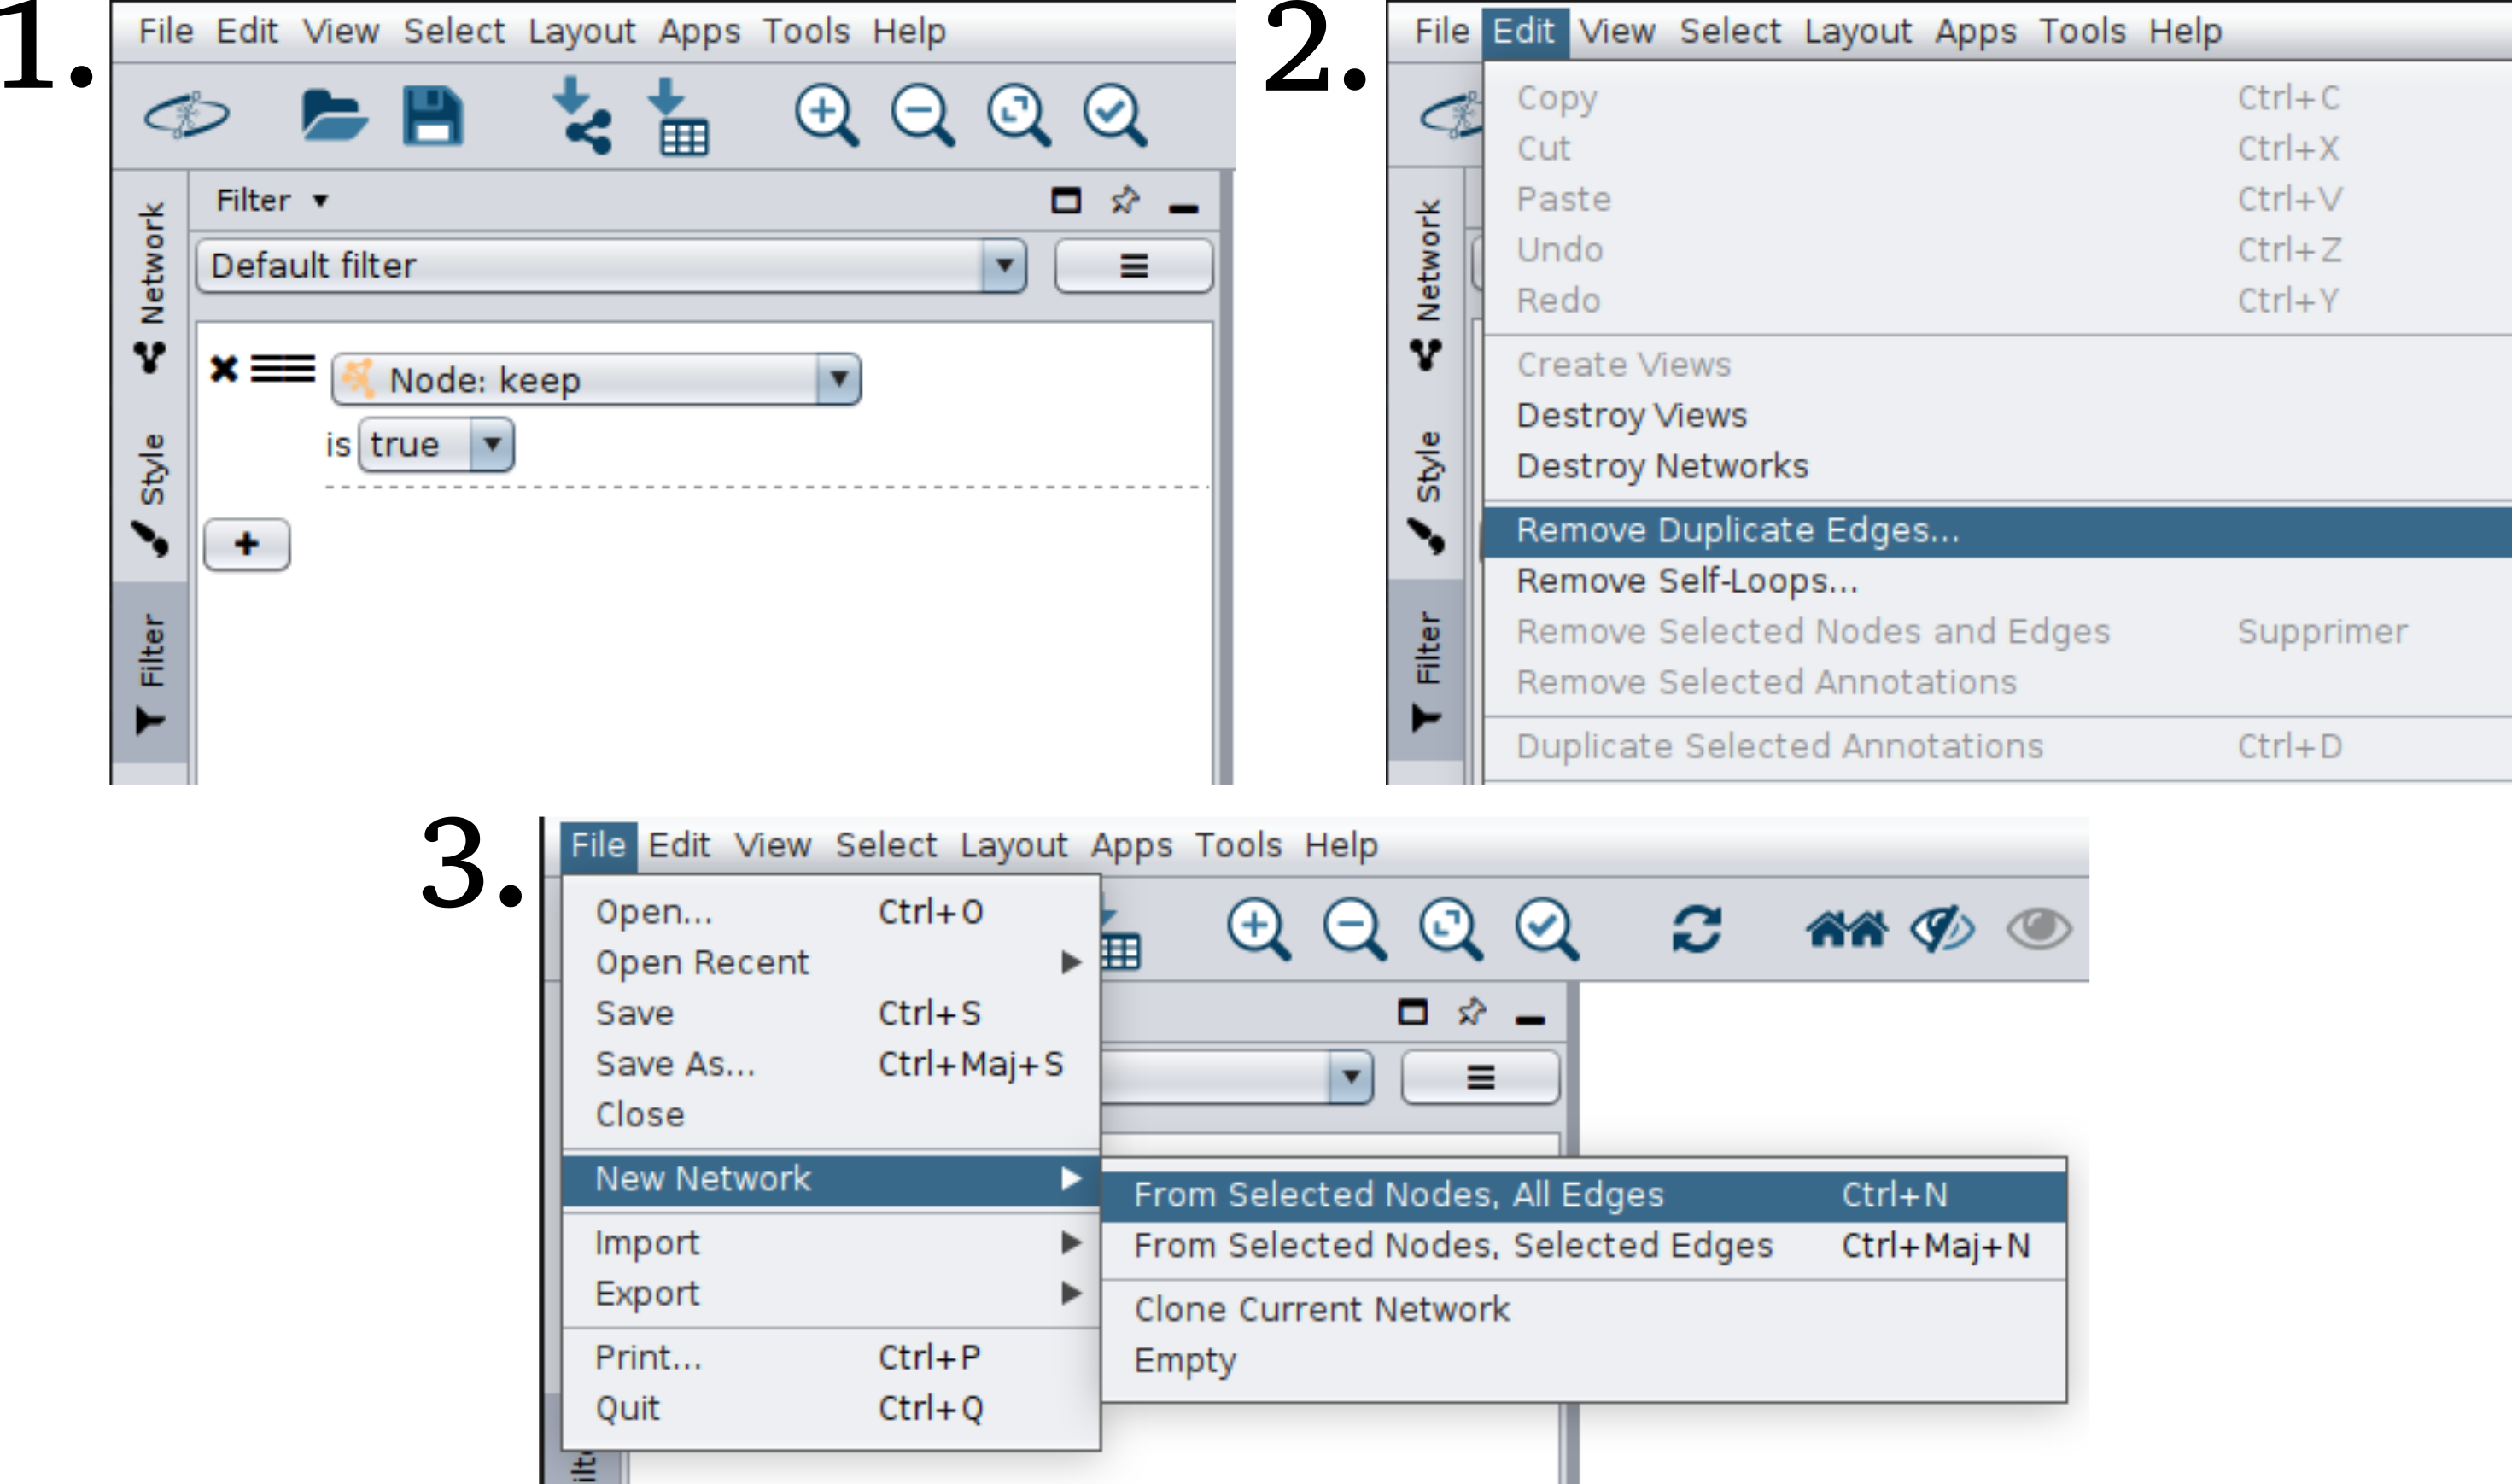
Fig. 16 : Step 3 - Select nodes using Filter, create a new network and remove duplicate edges
Filter: Select nodes with
keep = TrueNew Network: From Selected Nodes, All Edges
Edit and Remove Duplicate Edges
4. Network style
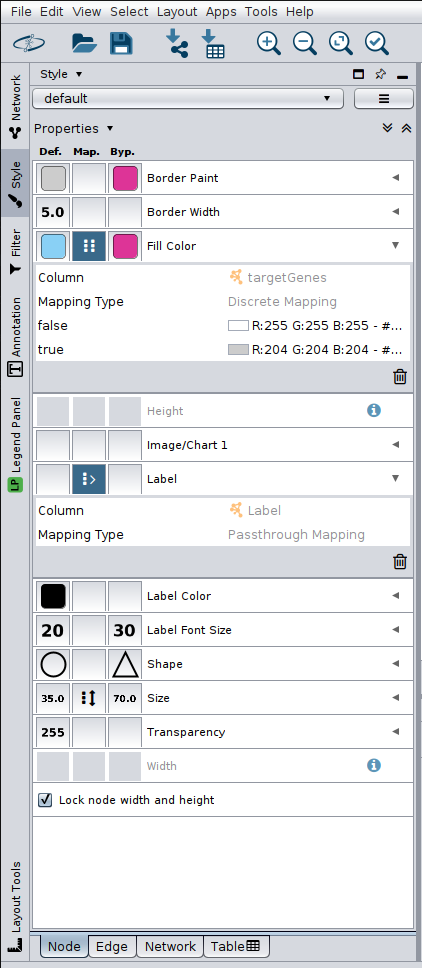
Fig. 17 : Step 4 - Apply style
Change the style of nodes
All Nodes |
Disease Nodes |
|
|---|---|---|
Border Width |
5.0 |
5.0 |
Fill Color |
Column seed
True: CCCCCC
False: FFFFFF
|
DD3497 |
Label Front Size |
20 |
50 |
Shape |
Ellipse |
Triangle |
Lock node width & height |
True |
True |
Size |
50 |
100 |
Label |
label |
label |
Change network layout (here we used yFiles Organic Layout)